You are reading a complimentary report. To find out more about our services,
Executive Summary
- Investors should worry much less about a US or global recession than they should worry about the bubble in anything AI-related.
- When bubbles burst, the investment priority is to steer well clear of the bursting bubble plus sectors, regions, and countries heavily exposed to it. Irrespective of whether the bursting bubble catalyses, or coincides with, a recession or not.
- On a cyclical (6-12 month) horizon, the investment conclusions are to:
- Stay overweight bonds and the JPY.
- Underweight US tech and quasi-tech.
- And underweight the US in a global equity portfolio.
- Tactically, SGD/USD is vulnerable to reversal…
- …and long copper versus gold is a good countertrend trade.
Tech Outperforms In Recessions Except When It Is A Bursting Bubble
 Fullscreen Fullscreen | Interactive Chart |
Feature
The question of whether, or when, the US economy will enter recession is exercising many smart minds. It is a moot question though, because US labour demand is already in the middle of a recession (Chart I-1).
Chart I-1
US Labour Demand Is Already In The Middle Of A Recession
| Fullscreen | Interactive Chart |
Since late-2023, US labour demand has declined by 1 percent.1 This puts it almost at the middle of the 2.5 percent peak-to-trough decline in labour demand suffered through the recessions of 1990 and 2001.
Which begs an obvious question: if US labour demand is in the middle of a typical recession, then why is US GDP still motoring along at a 2-3 percent clip? The answer is that the post-pandemic US economy has inverted from its usual ‘demand-constrained’ state to a highly unusual ‘supply-constrained’ state (Chart I-2).
Chart I-2
Unlike Other Economies, The US Economy Is 'Supply-Constrained', So Supply Rather Than Demand Is Driving The Economy
| Fullscreen | Interactive Chart |
In the supply-constrained state, it is the evolution of supply, not demand, that drives output. Consider the classic example of Wimbledon tickets, which are supply constrained. Supply is always well short of demand. So, even if demand declines, it is the evolution of supply – for example, from an extra allocation of seating – that drives the volume of Wimbledon tickets sold.
Likewise in the supply-constrained US economy, even as labour demand has gone into recession, the growth in labour supply has driven GDP. In a supply-constrained economy, output will go into recession only if supply goes into recession. Or if the economy ‘un-inverts’ back to demand-constrained and demand stays in recession.
How The US Could Cheat A GDP Recession
The US economy is still some ways from un-inverting, with labour demand still exceeding supply by 2.2 million jobs, or 1.3 percent.2 Moreover, as just discussed, if the current recession in labour demand is mild, as in 1990 or 2001, almost half of the decline in labour demand has already happened. By the time the economy un-inverts back to demand-constrained, most of the recession in labour demand will be over. Leading to a fascinating possibility:
The highly unusual inversion of the US economy means that despite suffering a typical labour demand recession, the US could cheat a GDP recession.
Some people contend that the inversion of the US economy is overstated because the jobs and job openings that make up labour demand are overstated. But in my analysis, the jobs data is based on the generally reliable Household Survey rather than the heavily (and recently) revised Establishment Survey. Meanwhile, the JOLTS job openings data can be independently verified by their excellent explanatory power for wage inflation.
If job openings were overstated, then they would be overestimating wage inflation. If anything, though, this explanatory relationship shows that job openings are slightly understated (Chart I-3).
Chart I-3
US Job Openings Are Not Overstated, Because They Are Correctly Predicting Wage Inflation
| Fullscreen | Interactive Chart |
Of course, one other possibility is that the supply-constrained US economy goes into recession because labour supply goes into recession. It could happen if labour participation fell sharply and/or net immigration turned into net emigration. This would be a major risk in a Trump administration, though that outcome is not my central case.
Other Developed Economies Already Had A Recession In 2023
Turning to the other developed economies, the question of whether, or when, they enter recession is also a moot question – because the G7-ex US economy already went into recession in 2023 (Chart I-4).
Chart I-4
The G7-Ex US Economy Already Went Into Recession In 2023
| Fullscreen | Interactive Chart |
The UK, Germany, and Japan went into technical recession in 2023 while Canada, France and Italy went extremely close (Chart I-5).
Chart I-5
The UK, Germany, And Japan Went Into Recession In 2023 While Canada, France And Italy Went Extremely Close
| Fullscreen | Interactive Chart |
Unlike the highly unusually supply-constrained US economy, all the other developed economies are still demand-constrained. So, when demand went into recession, GDP also went into recession, or extremely close.
One rejoinder is, if these developed economies went into recession, then why did unemployment not surge? A big clue comes from the UK. Although UK labour demand did fall by 2 percent, labour supply fell by almost the same amount. As unemployment is the balance of labour demand versus supply, it explains why UK unemployment did not surge even though the UK economy went into recession (Chart I-6).
Chart I-6
UK Unemployment Did Not Surge Because Labour Supply Fell Almost As Much As Labour Demand
| Fullscreen | Interactive Chart |
US Recession Or AI Bubble Bursting? The Bigger Risk Sets Your Investment Strategy
Let’s pull things together. The US could cheat a GDP recession, while the other major developed economies already went into, or close to, recession, in 2023.
This means that investors should worry much less about a US or global recession than they should worry about the bubble in anything AI-related. This to me is the bigger risk over the next 12 months, as I explained in BCA Research - Yen Carry And AI Bubble: One And The Same Trade.
The obvious pushback is that these two risks are not mutually exclusive. One risk could catalyse, or at least coincide with, the other risk.
In any case, does it really matter which is the bigger risk? The investment conclusions of the two risks are broadly the same – to overweight bonds versus stocks, and to overweight the Japanese yen.
The answer is it does matter. Because, while the conclusions for asset allocation are the same, the conclusions for sector, regional and country allocation are different.
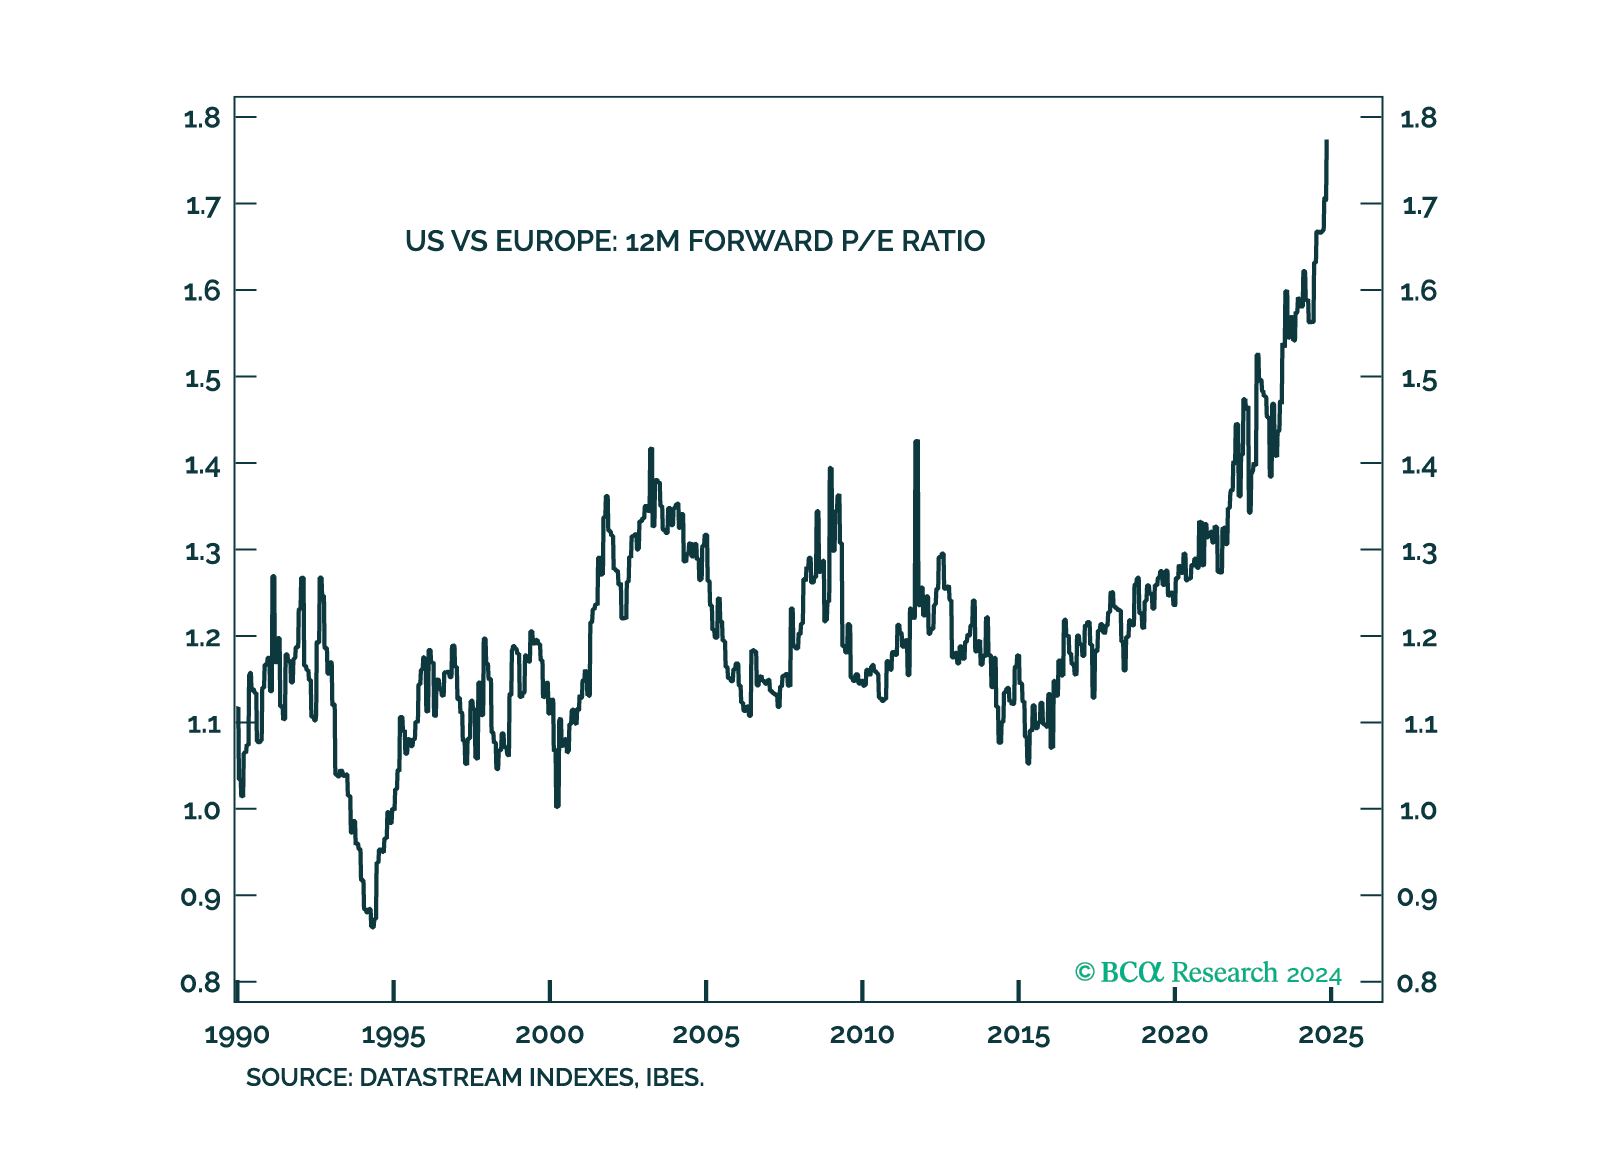
In recessions that coincide with a bursting bubble, the investment priority is to steer well clear of the bursting bubble. Specifically, in the 1990 recession, the priority was to steer clear of the bursting Japanese bubble. And in the 2001 recession, the priority was to steer clear of the bursting tech bubble, plus sectors, regions, and countries heavily exposed to it (Chart I-7).
Chart I-7
Tech Outperforms In Recessions Except When It Is A Bursting Bubble
| Fullscreen | Interactive Chart |
But in recessions that have not coincided with a tech bubble, tech has generally outperformed. In these recessions, investors were rewarded for overweighting tech, plus sectors, regions, and countries heavily exposed to it. Like the US.
Right now, I believe that the bubble in anything AI-related is the greater risk, irrespective of whether it catalyses, or coincides with, a US or global recession, or not.
Therefore, on a cyclical (6-12 month) horizon, the investment conclusions are to:
Stay overweight bonds and the Japanese yen.
Underweight US tech and quasi-tech.
And underweight the US in a global equity portfolio.
SGD/USD Vulnerable To Reversal, Copper/Gold Can Rebound
Finally, our monitoring of major investment price trend complexities highlights two interesting developments.
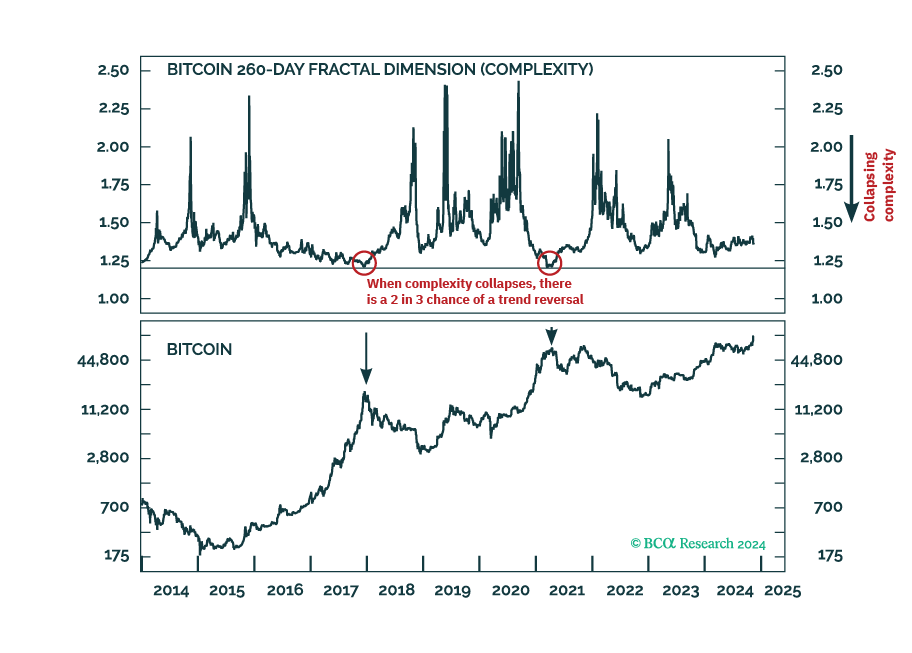
The near-vertical recent rally in SGD/USD is vulnerable to exhaustion, or reversal, given its collapsed 65-day price complexity (Chart I-8).
Chart I-8
SGD/USD Is Vulnerable To Reversal
| Fullscreen | Interactive Chart |
Likewise, the strong rally in gold is vulnerable to fading given its collapsing price trend complexity. Conversely, the sharp sell-off in copper is at a near-term exhaustion. This means that a good countertrend tactical trade is to go long copper versus gold, setting a profit target and symmetrical stop-loss at 5 percent (Chart I-9).
Chart I-9
Copper Versus Gold Can Rebound
| Fullscreen | Interactive Chart |
Dhaval Joshi
Chief Strategist
dhaval@bcaresearch.com
Footnotes
- 1 US labour demand is defined as jobs plus job openings plus workers on temporary layoff.
- 2 Based on June data.
Fractal Trading System (With Open Trades Highlighted)
| HISTORY | WINS | LOSSES | TRADES | WIN RATIO | WORST DRAWDOWN | RETURN |
| 6-Month | 4.2 | -2.0 | 10 | 68% | -7.4% | 4.4% |
| 1-Year | 10.7 | -7.80 | 26 | 58% | -9.2% | 6.1% |
| Since Inception | 159.5 | -108.7 | 325 | 59% | -11.1% | 173.5% |
1. THE SUMMARY HISTORY TREATS ALL "WINS" EQUALLY AND ALL "LOSSES" EQUALLY, AND ASSUMES POSITION SIZING IN WHICH FULL WINS GENERATE 2 PERCENT, AND FULL LOSSES GENERATE -2 PERCENT.
2. WINS AND LOSSES INCLUDE PARTIAL WINS AND LOSSES SO WILL NOT SUM TO TOTAL TRADES.
Fractal Trades
| TRADES INITIATED IN THE PAST 12 MONTHS | DATE | PROFIT TARGET / STOP-LOSS (%) | HIGH WATER MARK (%) | FRACTION OF PROFIT TARGET ACHIEVED | COMMENTS |
| Long Copper Vs. Gold | 28/08/2024 | 5.0 | Expires on 12/10/2024 | ||
| Long China Consumers ETF (CHIQ) Vs. S&P 500 | 14/08/2024 | 10.0 | 2.4 | -0.3 | Expires on 14/11/2024 |
| Long Global Materials ETF (MXI) Vs. MSCI AC World | 03/07/2024 | 5.0 | 2.4 | 0.2 | Expires on 03/10/2024 |
| Long Global Consumer Discretionary ETF (RXI) Vs. MSCI AC World | 05/06/2024 | 5.0 | 0.2 | -0.5 | Expires on 05/09/2024 |
| Short Global Base Metals Index ETF (XBM) | 22/05/2024 | 14.0 | 14.0 | 1 | Closed on 01/07/2024 |
| Long SBUX Vs. S&P 500 | 01/05/2024 | 20.0 | 5.5 | -0.22 | Closed on 01/08/2024 |
| Long IXJ Vs. MSCI AC World | 17/04/2024 | 4.0 | 4.0 | 1 | Closed on 02/08/2024 |
| Short USD/CHF | 10/04/2024 | 3.5 | 0.8 | 0.00 | Closed on 25/05/2024 |
| Short Gold | 03/04/2024 | Price $2,140 | None | -1 | Closed on 17/05/2024 |
| Long MSCI Portugal Vs. Europe | 13/03/2024 | 9.0 | 9.0 | 1 | Closed on 29/04/2024 |
| Short USD/CLP | 13/03/2024 | 5.0 | 5.0 | 1 | Closed on 17/05/2024 |
| Long France (CAC 40) Vs. Japan (TOPIX) | 28/02/2024 | 7.5 | 3.7 | -0.07 | Closed on 28/05/2024 |
| Short Cocoa | 14/02/2024 | 35.0 | 7.6 | -0.97 | Closed on 14/06/2024 |
| Long Gaming (BJK) Vs. Cybersecurity (CIBR) ETF | 07/02/2024 | 10.0 | 5.4 | -0.08 | Closed on 07/05/2024 |
| Short Semiconductors (SOXX) | 31/01/2024 | 10.0 | None | -1 | Closed on 29/02/2024 |
| Short Gold | 17/01/2024 | 5.0 | 2.3 | -0.36 | Closed on 02/03/2024 |
| Long USD/CHF | 10/01/2024 | 5.0 | 5.0 | 1 | Closed on 21/03/2024 |
| Long MSCI Switzerland Vs. World | 13/12/2023 | 6.5 | 2.6 | -1 | Closed on 07/05/2024 |
| Long Biotech & Genome ETF (PBE) Vs. S&P 500 | 06/12/2023 | 10.0 | 6.4 | -0.89 | Closed on 06/06/2024 |
| Short Cocoa | 15/11/2023 | 25.0 | 3.8 | -1 | Closed on 08/02/2024 |
| Long PBJ Vs. S&P 500 | 01/11/2023 | 8.0 | 0.9 | -0.38 | Closed on 01/05/2024 |
| Long IDR/USD | 01/11/2023 | 3.5 | 3.5 | 1 | Closed on 29/11/2023 |
| Long CLP/USD | 18/10/2023 | 6.0 | 6.0 | 1 | Closed on 02/11/2023 |
| Long iShares 20+ Year T-Bond ETF (TLT) | 12/10/2023 | PRICE 93.2 | 8.3 | 1 | Closed on 05/12/2023 |
| Long Tin Vs. Aluminum | 04/10/2023 | 10.0 | 10.0 | 1 | Closed on 17/10/2023 |
| Short European Oil Vs. Market | 20/09/2023 | 6.5 | 6.5 | 1 | Closed on 06/12/2023 |
| Long USD/MXN | 06/09/2023 | 6.0 | 5.4 | 0.53 | Closed on 18/10/2023 |
6-12 Month Recommendations
1 - STRONG UNDERWEIGHT
2 - UNDERWEIGHT
3 - NEUTRAL
4 - OVERWEIGHT
5 - STRONG OVERWEIGHT
* RELATIVE TO MSCI ACWI (CURRENCY UNHEDGED).
** RELATIVE TO BLOOMBERG GLOBAL AGGREGATE (CURRENCY-HEDGED).
*** IN TRADE-WEIGHTED TERMS.
Structural Recommendations
| Asset Allocation | Initiate Date | Total Return | Comments |
| Long Healthcare And US T-Bond (40:60 Combination) | 13 Mar 2014 | 95.3 |
| Equity Allocation | Initiate Date | Total Return | Comments |
| Long MSCI Europe Versus EM | 26 Jun 2024 | 3.3 | |
| Long CAC 40 Versus Eurostoxx 50 | 30 Aug 2023 | -9.5 | |
| Long French Luxury Goods Versus US Technology | 30 Aug 2023 | -35.5 | |
| Long Stoxx Europe 600 Versus S&P 500 | 01 Feb 2023 | -16.1 | |
| Long US Biotech Versus Tech | 24 Feb 2022 | -33.3 | |
| Long Interactive Entertainment | 16 Dec 2021 | -6.4 | |
| Long French Luxury Goods | 06 Dec 2018 | 152.1 | |
| Long Animal Healthcare Basket | 10 Aug 2017 | 87.7 | |
| Long Euro Area Personal Products And Cosmetics | 22 Dec 2011 | 354.0 | |
| Long Healthcare Versus Market | 14 Apr 2011 | 52.1 |
| Bonds, Rates and Currency Allocations | Initiate Date | Total Return | Comments |
| Long SOL, ETH, MATIC, ADA, AVAX | 26 Jul 2023 | 123.7 | |
| Long US Dollar (DXY) | 18 Nov 2021 | 5.2 | |
| Long China 30-Year Govt. Bond | 23 Sep 2021 | 24.1 | |
| Long 50:50 Portfolio Of Ethereum And Bitcoin | 08 Apr 2021 | 9.9 | |
| Long 50:50 Platinum And Silver Vs. Gold | 08 Apr 2021 | -32.9 | |
| Long 30-Year T-Bond+Bono/Short 30-Year Bund+OAT | 24 Oct 2019 | 41.8 | |
| Long 10-Year IT BTPS/Short 10-Year SP Bonos | 20 Dec 2018 | 10.5 |
Indicators To Watch - Bond Yields
Chart II-1
Indicators To Watch - Bond Yields - Euro Area
| Fullscreen | Interactive Chart |
Chart II-2
Indicators To Watch - Bond Yields - Europe Ex Euro Area
| Fullscreen | Interactive Chart |
Chart II-3
Indicators To Watch - Bond Yields - Asia
| Fullscreen | Interactive Chart |
Chart II-4
Indicators To Watch - Bond Yields - Other Developed
| Fullscreen | Interactive Chart |
Indicators To Watch - Interest Rate Expectations
Chart II-5
Indicators To Watch - Interest Rate Expectations
| Fullscreen | Interactive Chart |
Chart II-6
Indicators To Watch - Interest Rate Expectations
| Fullscreen | Interactive Chart |
Chart II-7
Indicators To Watch - Interest Rate Expectations
| Fullscreen | Interactive Chart |
Chart II-8
Indicators To Watch - Interest Rate Expectations
| Fullscreen | Interactive Chart |